Weekly Market Report

17 March 2026

Global Report

Emerging Markets Flex their Muscles.

Learn more 

Local Report

Still Complicated, but Quietly Improving.

Learn more

Market Indicators

Global and Local Indicators.

Learn more

Global Report: Recommended investor response to the Iran war

By Nick Downing

The US-Israeli military campaign against Iran, launched on 28th February, is now in its third week. By far the greatest cost is the loss of life, but the conflict has potentially severe global economic consequences. The near shutdown of the Strait of Hormuz, through which roughly 20% of oil and LNG flows, combined with OPEC production cuts and attacks on regional energy infrastructure, has sent crude oil prices surging. Higher oil prices, if sustained, will drive up inflation, cut household purchasing power and damage GDP growth across the world’s economies. The IMF estimated in 2023 that a sustained 10% rise in oil prices would reduce global growth by about 0.15% and push up global inflation by about 0.4%.

The impact would vary across countries depending on their domestic energy mix, the balance of energy imports and exports, and the energy intensity of their economies. European and Asian economies, most reliant on energy imports, face a much sharper increase in inflation. The US economy is less vulnerable to energy shocks than in past decades. Energy intensity has fallen sharply as the economy has shifted away from manufacturing towards services, while fuel efficiency improvements and technological gains have also reduced oil dependence. Domestic production has also increased dramatically. US crude oil output, including natural gas liquids and renewable fuels, now stands near a record 24 million barrels per day, exceeding domestic consumption of about 21 million barrels per day.

On 9th March, following a record weekly increase in oil prices, Brent, the international oil price benchmark, leapt by 25% in a single day. Marking the biggest intraday price swing, the Brent crude price surged to as high as $119 a barrel before plunging to $84. The difference between buying and selling prices, known as the spread, which is normally a few cents a barrel, widened dramatically to as much as $10. The price fell after President Trump suggested the conflict would end “very soon”, prompting a return of the TACO trade (Trump Always Chickening Out).

How serious could the economic and financial market impact be? History indicates that wars only have a sustained impact on financial markets if they materially alter the economic outlook. The world economy had considerable momentum before the war, which, combined with stimulative monetary and fiscal policy, should enable the expansion to continue. Moreover, oil is not yet historically expensive, and there is considerable supply potential to cushion the war’s impact. Global expenditures on crude oil as a share of GDP are toward the low end of a multi-decade range. They would need to rise far above current levels to tip the global economy into recession.

The impact on financial impacts so far has been likened to a “mere flesh wound”, prompting little more than spring cleaning by fund managers. The consensus opinion appears to be that the conflict will be severe but short-lived, limited to little more than 2-3 weeks. Once over, Iranian attacks on the Gulf countries and in the Strait of Hormuz would cease, allowing global energy supplies from the region to normalise. However, the longer the conflict lasts, the higher the probability of more severe economic damage.

Independent research firm, Capital Economics, has outlined two more sinister scenarios. In the milder one, the conflict lasts about three months, but there is limited damage to Gulf energy infrastructure, which is quickly repaired. The oil price would rise to around $130 per barrel in the second quarter. GDP growth in the eurozone would slow to just 0.5% year-on-year in the second half of the year, while the US would retain growth of 2.25% in 2026. Inflation would peak at 4% in the eurozone, 3% in the US. The ECB would hike interest rates.

In the worst-case scenario, the conflict also lasts about three months, but there is longer-lasting damage to production capacity in both Iran and the Gulf. Brent crude oil prices could rise to an average of $150 per barrel over the next six months or so, and the subsequent price decline would only be gradual. In this scenario, global GDP would average just 1% annualised in the first half of the year, meeting the definition of a global recession. With inflation rising to over 5% in the eurozone and 4% in the US, this would be textbook “stagflation”. Stagflation is when inflation soars while economic growth slows, a dire combination which is often regarded as the worst-case scenario for the economy.

Normally, central banks are willing to look through the temporary inflationary impact of a supply shock. With consumer inflation expectations still elevated in the aftermath of the COVID pandemic and the Ukraine War, when central banks were overly optimistic in their diagnosis of “transitory” price effects, they may be more reluctant to cut interest rates. Before the conflict, the ECB had been expected to continue its rate-cutting cycle, but is now expected to lift its key rate once or twice this year. Earlier predictions that the Bank of England would cut by a quarter point this year have evaporated. The Fed is only predicted to cut by a further 30 basis points compared with predictions of 70 basis points in late February. The risk of rising inflation expectations and fading rate cut prospects has caused a major sell-off in bonds. The yield on the all-important 10-year US Treasury bond has jumped since the conflict began from less than 4% to around 4.25%, and the jump in government bond yields elsewhere has been as significant.

The US and Israel enjoy military supremacy, giving President Trump the upper hand in dictating terms for the conflict, such as when it ends. Mindful of rapidly rising fuel prices and the impact of the growing “affordability crisis” on his popularity amongst voters, he will no doubt want to end the war well before the crucial November Mid-Term elections. However, Iran has remained defiant, and it is not clear that Trump can necessarily stop what he, with Israel, has started. Iran will hope to emulate the Red Sea crisis in late 2023, when Iran-backed Houthi rebels continued to disrupt shipping with inexpensive drones and missiles. The crisis dragged on despite overwhelming displays of US air superiority.

The Trump administration may have miscalculated the effects of the war. Iran’s regime is so institutionalised that taking out the leadership has failed to have the desired impact. The leadership was swiftly replaced, dispelling any hope of a people’s uprising. The regime’s desperation, its willingness to fight on against all odds and to sacrifice its own economy by blockading the Strait of Hormuz was also underestimated, adding to uncertainty over the duration of the war and its impact on the oil price.

Markets do not like uncertainty, and they dislike stagflation even less. However mild the oil shock may be versus 1979 or 2022, it is the direction of travel which moves financial markets. There have been some dire warnings. Goldman Sachs has warned that if the crisis continues throughout March, oil prices will likely exceed their 2008 and 2022 peaks when Brent went above $147 per barrel. Respected economist and investment strategist Ed Yardeni says the oil price shock has increased the probability of a stock market meltdown to 35%, up from 20% previously, and he sees a 15% chance of a “Stagflation 1970s Redux”, which he previously ascribed a zero probability.

Yet, despite increasing risks, Yardeni and his team retain an optimistic base case outlook for stock markets, premised on an end to the conflict and the resumption of a productivity-led boom. Overberg Asset Management keeps a similarly positive base case outlook and is maintaining its portfolios as they are, besides minor spring cleaning and an increased weighting to the long-held position in the defence sector. Like oil stocks, defence stocks have outperformed since the conflict began, but whereas oil stocks will fall back once the crisis ends amid growing global supply and declining intensity of oil consumption, global defence spending is expected to continue rising over the next ten years, as a percentage of global GDP.

Local Report: Green shoots and headwinds: The state of South Africa’s economy

By Werner Erasmus

Turning the Corner: 2025 has proven to be a pivotal year for the South African economy. After a decade of being stuck in a “1% growth trap,” we are finally seeing the benefits of sustained domestic reforms. While the war in the Middle East and the resulting oil shock have recently rattled markets, the domestic story is one of emerging “green shoots” and a steadier growth trajectory. Progress made in 2025 includes: a reduction in loadshedding, lower inflation, lower interest rates, the new 3% inflation target, removal from the FATF grey list, a credit ratings upgrade, GNU stability and declining bond yields. This represents a shift toward a more predictable and constructive investment environment, even as we navigate new international headwinds. South Africa is not out of the woods yet, but the direction of travel is positive.

Economic Growth in 2025: South Africa’s economic growth continues to be slow and uneven. The South African economy grew by 0.4% in the fourth quarter of 2025, marking the fifth consecutive quarter of expansion. This is the longest unbroken growth phase we have seen since 2018. The recovery was driven by the services sector, particularly finance and trade, while mining and manufacturing faced some headwinds.

Graph 1: Supply Side (Production) GDP Performance (Q4: 2025)

(Source: Stats SA)

For the full year, real GDP grew by 1.1%. This is more than double the 0.5% growth seen in 2024 and is a testament to the resilience of the South African consumer. Household consumption expenditure was the standout, rising by 3.6% for the year, supported by easing inflation and a modest recovery in real incomes.

Graph 2: 2025 Annual Real GDP Growth Rate (constant 2015 prices)

(Source: Stats SA)

What Will Drive Economic Growth Going Forward? Despite the recent oil shock, the expectation is for growth to accelerate as structural and cyclical “tailwinds” align:

  • Operation Vulindlela: Operation Vulindlela is South Africa’s premier reform program, aiming to accelerate structural reform implementation. Phase II of this reform program is now tackling rail and port bottlenecks, which should unlock greater export volumes in the medium term.
  • Ports & Rail: Port and rail throughput have improved in 2025. Durban container two terminal operations have also improved, with further improvement expected following the appointment of International Container Terminal Services.
  • Energy: Roughly 18GW of private electricity capacity is now in development, and load-shedding has been largely eradicated. Eskom’s unbundling is also progressing and confirmed by the President during his State of the Nation address. Credit guarantees from the World Bank have been secured for the roll-out of the transmission development plan, which is a critical next step in restructuring South Africa’s energy market.
  • Water: Overall progress has been slow, but a faster water use license application process is supporting investment. The president, in his SONA, acknowledged the severity of the water shortage, particularly in Gauteng. He announced a National Water Crisis Committee, which he will personally chair, modelled on the energy crisis response. R156 billion is committed to water and sanitation infrastructure over the next three years.
  • Improving confidence: Business confidence is rising, and political stability under the GNU continues to support private sector investment.

Risks to Future Economic Growth: Looking ahead, various risks to the improved economic outlook remain. These risks include ongoing water shortages, municipal financial distress, crime and corruption and the recent oil shock.

What the recent oil shock means for South African investors:

  • Fuel and inflation: As a net oil importer, higher global prices feed directly into local petrol and diesel costs. A large price hike is expected in April, which will likely push up transport and food costs.
  • Delayed interest rate relief: While the expectation is for the SARB to continue cutting rates, the oil shock may delay the easing cycle. We anticipate that rate cuts may be paused until these temporary inflation pressures fade.
  • The buffer: Fortunately, South Africa’s stronger public finances and the spiking prices of gold and coal provide a sizeable buffer. Higher export prices for our minerals help offset the cost of expensive oil imports (for now).

The Bureau of Economic Research (BER) expects the war to have a modest impact on SA growth (around 0.1-0.2ppt), but a prolonged disruption would weigh more heavily on household purchasing power.

Outlook: The Path to 2% Growth: The outlook for South African growth remains constructive, and one must guard against overreacting to global headlines. We expect a gradual lift toward a sustainable 2% trend growth over the next few years. The increase in economic growth is expected to be driven by an increase in Gross Fixed Capital Formation over the medium term. While the global environment is “jittery,” the foundations of the SA economy are much stronger than they were two years ago.

We remain constructive on quality domestic stocks in the banking and construction sectors, including shares that can grow earnings in an uneven growth environment. While maintaining a cautiously optimistic outlook on South Africa’s recovery, we continue to prioritise risk management by diversifying local portfolios with offshore exposure to hedge against unexpected economic and political shocks.

Disclaimer

Information and opinions presented in this Market Report were obtained or derived from public sources that Overberg Asset Management believes are reliable, but makes no representations as to their accuracy or completeness. Any opinions, forecasts or estimates herein constitute a judgment as at the date of this Market Report and should not be relied upon. There can be no assurance that future results or events will be consistent with any such opinions, forecasts, or estimates. Furthermore, Overberg Asset Management accepts no responsibility or liability for any loss arising from the use of or reliance placed upon the material presented in this Market Report.
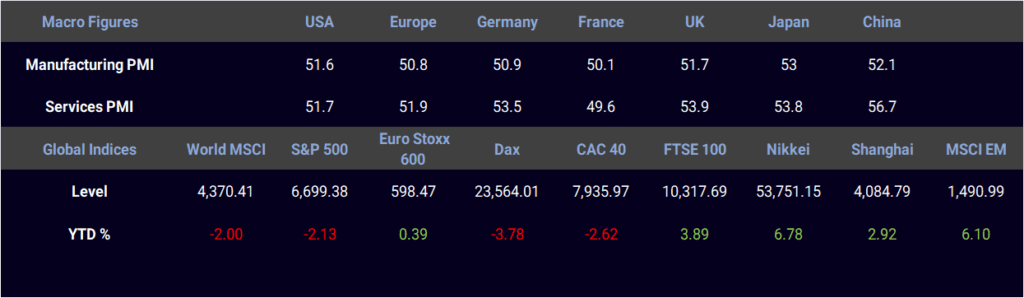
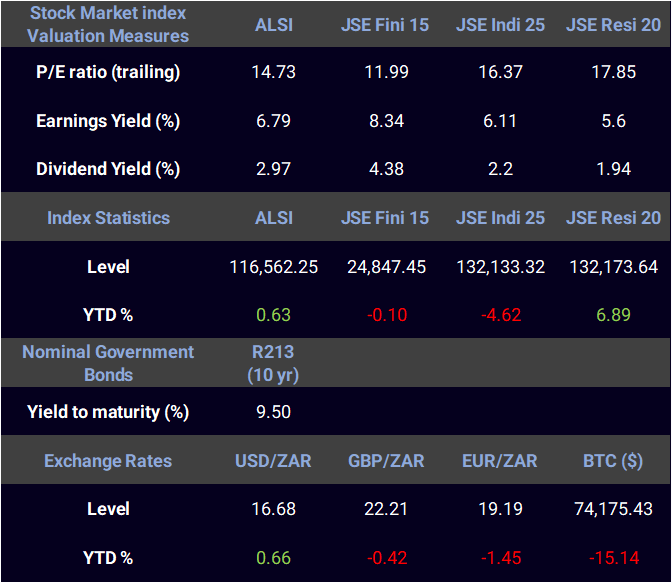
Market Indicators

Make use of the many indicators below simply by clicking on each of the dropdown menus provided

Edit Content
Edit Content

Reference: Capital Economics – Historical bond and equity return data.

Invest Today

Spend some time with our team to find out which one of our portfolios is best for you!